Bitcoin Cash Price Comparison: BCH prices up by 4% since past 2 days, can it beat its previous best figures?
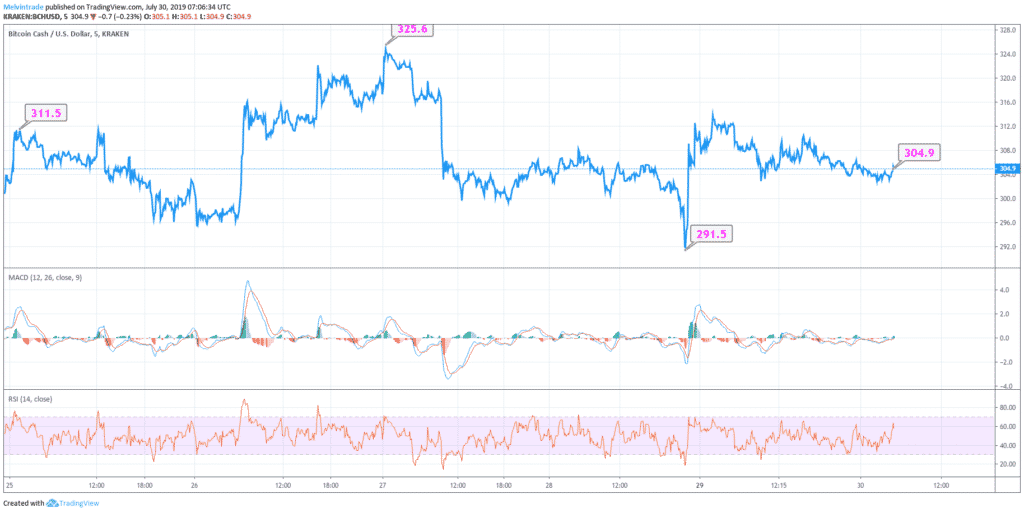
BCH started off on 25-July-19 at about $311.5 at 01:15 UTC time. It continued to fall until the next day there was a steep rise and prices reached $325.6 on 27-July-19 at 00:20 UTC time. However, the coin could not manage to maintain the same performance standards and began descending. With two sharp falls, BCH fell as low as $291.5 two days back.
Since past two days, the BCH/USD has been trading at almost the same pace. We anticipate that the bearish run may continue for few more days.
Let us look at how the Bitcoin Cash has performed:

Current Figures of BCH:
-
BCH remains stable at number 5.
-
Market value of Bitcoin Cash was 5,501,115,840 at 6:54 UTC.
-
Price of BCH is $304.9 at 07:15 UTC time.
-
24-hour volume figures are $1,223,998,895
-
17,919,413 BCH coins are being traded.
-
ROI of BCH stands at -44.78%.
BCH Price Analysis and Future Prediction:
If we compare BCH’s prices of today and the price of the coin when it reached the lowest point of $291.5 on 28-July-19 at 22:30 UTC, the present trend indicates a bearish run by 4%.
We anticipate that BCH may continue to fall marginally by tomorrow with prices reaching around $304.5 by tomorrow. After about 7 days BCH may still be traded around the range of $301 and $304. The present scenario is expected to change after few weeks and the coin can reach $310 by August,19.
The MACD indicator highlights that the coin is almost on the verge of turning bullish. We expect that this may happen after few weeks to come once the coin has managed to gain back its pace. As per the RSI indicator, the coin has been overbought and oversold several times as well over the past 5 days.
As per the current momentum, it may take several months for Bitcoin Cash to overcome its previous best figures but once it is able to do that, there is no stopping for the coin.